import numpy as np
import matplotlib.pyplot as plt

# 设置中文字体与负号支持
plt.rcParams['font.sans-serif'] = ['Microsoft YaHei', 'SimHei', 'PingFang SC', 'Noto Sans CJK SC', 'DejaVu Sans']
plt.rcParams['axes.unicode_minus'] = False

# 参数设定
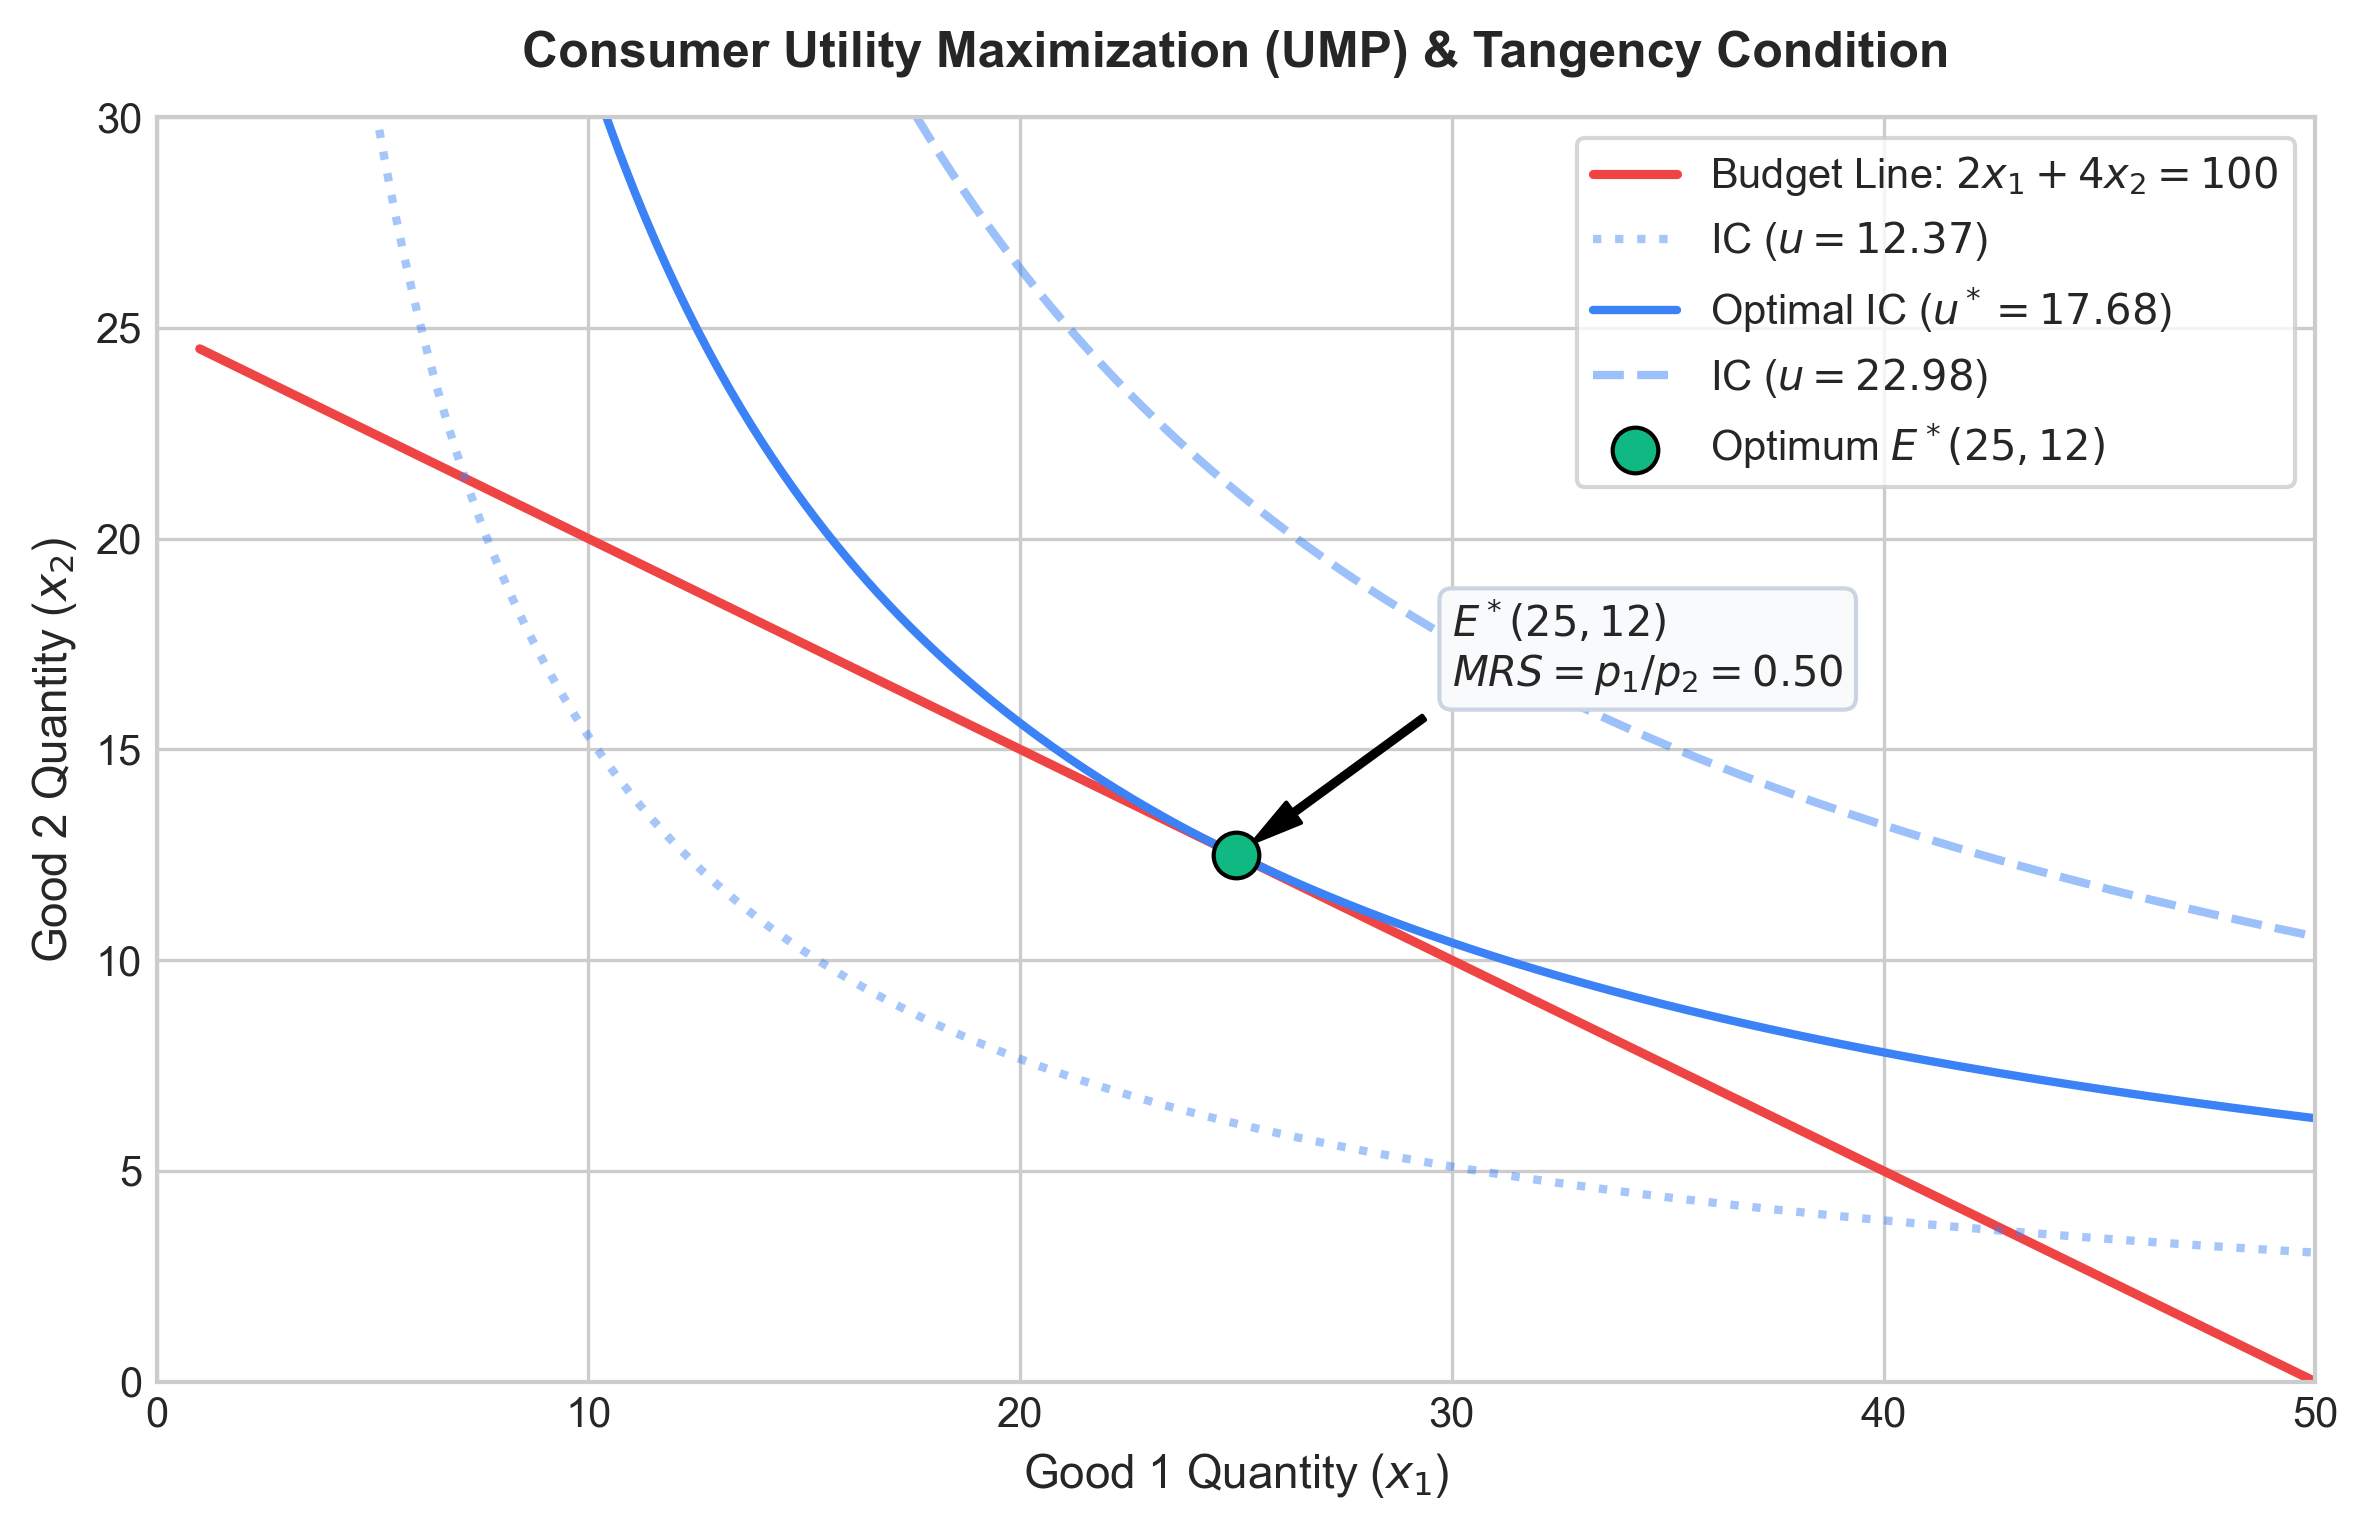
p1, p2, w = 2.0, 4.0, 100.0
alpha = 0.5

# 解析最优解 (马歇尔需求)
x1_opt = (alpha * w) / p1
x2_opt = ((1 - alpha) * w) / p2
u_max = (x1_opt ** alpha) * (x2_opt ** (1 - alpha))

# 生成网格数据
x1 = np.linspace(1, 50, 400)
budget_x2 = (w - p1 * x1) / p2

# 绘制图形
plt.style.use('seaborn-v0_8-whitegrid' if 'seaborn-v0_8-whitegrid' in plt.style.available else 'default')
fig, ax = plt.subplots(figsize=(8, 5.2), dpi=150)

# 绘制预算线
ax.plot(x1, budget_x2, label=rf'Budget Line: ${p1:.0f}x_1 + {p2:.0f}x_2 = {w:.0f}$', color='#ef4444', linewidth=2.2)

# 绘制不同效用水平的无差异曲线
for u_level, style, alpha_val in [(u_max * 0.7, ':', 0.45), (u_max, '-', 1.0), (u_max * 1.3, '--', 0.5)]:
    indiff_x2 = (u_level / (x1 ** alpha)) ** (1 / (1 - alpha))
    label_txt = rf'Optimal IC ($u^* = {u_max:.2f}$)' if u_level == u_max else rf'IC ($u = {u_level:.2f}$)'
    ax.plot(x1, indiff_x2, linestyle=style, color='#3b82f6', alpha=alpha_val, linewidth=2, label=label_txt)

# 标出最优切点
ax.scatter([x1_opt], [x2_opt], color='#10b981', s=120, zorder=5, edgecolors='black', label=rf'Optimum $E^* ({x1_opt:.0f}, {x2_opt:.0f})$')
ax.annotate(rf'$E^* ({x1_opt:.0f}, {x2_opt:.0f})$' + '\n' + rf'$MRS = p_1/p_2 = {p1/p2:.2f}$',
            xy=(x1_opt, x2_opt), xytext=(x1_opt + 5, x2_opt + 4),
            arrowprops=dict(facecolor='black', shrink=0.08, width=1.2, headwidth=6),
            fontsize=10, fontweight='semibold', bbox=dict(boxstyle="round,pad=0.3", fc="#f8fafc", ec="#cbd5e1"))

ax.set_xlim(0, 50)
ax.set_ylim(0, 30)
ax.set_xlabel(r'Good 1 Quantity ($x_1$)', fontsize=11)
ax.set_ylabel(r'Good 2 Quantity ($x_2$)', fontsize=11)
ax.set_title(r'Consumer Utility Maximization (UMP) & Tangency Condition', fontsize=12, fontweight='bold', pad=12)
ax.legend(loc='upper right', frameon=True)
plt.tight_layout()
plt.show()